| Candidates | 
Gingrich |

Paul |
Romney |
 Rick Santorum | Totals 1,144 needed to win |
||||
| Delegate Totals
total: 2,286 |
143 | 150 | 1,148 | 269 | 1,712
total delegates |
||||
| Superdelegate Totals
total: 132 | 2 | 1 | 54 | 1 | 58
superdelegates |
||||
| Projected Delegate Totals
total: 2,166 | 148 | 140 | 1,094 | 268 | 1,650
pledged delegates |
||||
| Popular vote totals | 2,636,828
(15.94%) |
1,821,126
(11.01%) |
7,882,234
(47.66%) |
3,779,634
(22.86%) |
16,301,022 total votes |
||||
| Jan. 3 | Iowa Nonbinding Caucus |
13% (4 delegates) (16,163 votes) |
21% (7 delegates) (26,036 votes) |
25% (7 delegates) (29,805 votes) |
25% (7 delegates) (29,839 votes) |
25 (121,479 votes) |
|||
| Jan. 10 | New Hampshire Modified Primary |
9% (0 delegates) (23,291 votes) |
23% (3 delegates) (56,872 votes) |
39% (7 delegates) (97,600 votes) |
9% (0 delegates) (23,362 votes) |
12 (248,448 votes) |
|||
| Jan. 21 | South Carolina Open Primary |
40% (23 delegates) (243,323 votes) |
13% (0 delegates) (78,036 votes) |
28% (2 delegates) (167,417 votes) |
17% (0 delegates) (102,113 votes) |
25 (601,577 votes) |
|||
| Jan. 31 | Florida Closed Primary |
32% (0 delegates) (533,117 votes) |
7% (0 delegates) (117,105 votes) |
46% (50 delegates) (775,014 votes) |
13% (0 deletates) (222,798 votes) |
50 ( 1,669,649 votes) |
|||
| Feb. 4 | Nevada Binding Caucus |
21% (6 delegates) (6,956 votes) |
19% (5 deletates) (6,175 votes) |
50% (14 deletates) (16,486 votes) |
10% (3 deletates) (3,277 votes) |
28 (32,894) |
|||
| Feb. 4-11 | Maine Nonbinding Caucus |
7% (1 deletates) (391 votes) |
35% (8 delegates) (2,030 votes) |
39% (8 deletates) (2,269 votes) |
18% (4 deletates) (1,052 votes) |
24
(6,814) |
|||
| Feb. 7 | Colorado Nonbinding Caucus |
13% (2 delgtates) (8,445 votes) |
12% (1 delegate) (7,759 votes) |
35% (13 delegates) (23,012 votes) |
40% (17 deletates) (26,614 votes) |
0 (66,027) |
|||
| Missouri Caucus |
didn’t qualify for the ballot | 12% (0 delegates) (30,641 votes) |
25% (0 delegates) (63,826 votes) |
55% (0 deletates) (138,597 votes) |
0 (251,868) |
||||
| Minnesota Nonbinding Caucus |
11% (1 delegates) (5,276 votes) |
27% (4 deletates) (13,258 votes) |
17% (2 delegates) ( 8,231 votes) |
45% (6 deletates) ( 21,985 votes) |
0 ( 48,893 ) |
||||
| Feb. 28 | Arizona Closed Primary |
16% (0 delegates) ( 74,110 votes) |
8% (0 delegates) (38,753 votes) |
47% (29 deletates) ( 216,805 votes) |
27% (0 deletates) (122,088 votes) |
29 (458,631 ) |
|||
| Michigan Closed Primary |
7% (0 delegates) (65,002 votes) |
12% (0 delegates) ( 115,778 votes) |
41% (15 deletates) ( 409,120 votes) |
38% (13 deletates) (377,144 votes) |
30 (996,126) |
||||
| Feb. 11-29 | Wyoming Non-binding Caucuses |
8% (2 delegates) (165 votes) |
21% (6 delegates) ( 439 votes) |
39% (10 deletates) ( 822 votes) |
32% (8 deletates) (673 votes) |
0 (2,108) |
|||
| Mar. 3 | Washington Nonbinding Caucus |
10% (4 delegates) (5,221 votes) |
25% (10 deletates) (12,594 votes) |
38% (16 deletates) (19,111 votes) |
24% (10 delegates) ( 12,089 votes) |
43 ( 50,764 votes) |
|||
| Super Tuesday Mar. 6 | Alaska Binding Caucus |
14% (3 delegates) (1,832 votes) |
24% (6 delegates) (3,106 votes) |
33% (8 deletates) (4,224 votes) |
29% (7 deletates) (3,760 votes) |
27 (12,956 votes) |
|||
| Georgia Modified Primary |
47% (46 deletates) (417,362 votes) |
6% (0 delegates) (57,126 votes) |
26% (13 delegates) ( 225,925 votes) |
20% (2 delegates) ( 172,471 votes) |
76 ( 879,763 votes) |
||||
| Idaho County Caucuses |
2% (0 delegates) (938 votes) |
18% (0 delegates) ( 8,087 votes) |
62% (32 deletates) (27,513 votes) |
18% (0 delegates) ( 8,113 votes) |
32 ( 44,667 votes) |
||||
| Massachusetts
Modified Primary |
5% (0 delegates) (16,754 votes) |
10% (0 delegates) ( 34,576 votes) |
72% (38 deletates) (260,508 votes) |
12% (0 delegates) ( 43,612 votes) |
41 ( 361,387 votes) |
||||
| North Dakota Binding Caucus |
8% (2 delegates) (960 votes) |
28% (8 delegates) ( 3,187 votes) |
24% (7 delegates) ( 2,690 votes) |
40% (11 deletates) (4,508 votes) |
28 (11,345 votes) |
||||
| Ohio Modified Primary |
15% (0 delegates) (174,604 votes) |
9% (0 delegates) (110,634 votes) |
38% (35 deletates) (453,926 votes) |
37% (21 delegates) (441,906 votes) |
66 (1,194,873 votes ) |
||||
| Oklahoma
Closed Primary |
27% (13 delegates) (78,684 votes) |
10% (0 delegates) (27,573 votes) |
28% (13 delegates) (80,290 votes) |
34% (14 deletates) (96,757 votes) |
43 (286,301 votes) |
||||
| Tennessee Open Primary |
24% (12 delegates) (132,140 votes) |
9% (0 delegates) (49,783 votes) |
28% (15 delegates) (153,888 votes) |
37% (27 deletates) (204,976 votes) |
58 (550,174 votes) |
||||
| Vermont Open Primary |
8% (0 delegates) (4,606 votes) |
25% (4 delegates) (14,408 votes) |
40% (9 deletates) (24,532 votes) |
24% (4 delegates) (13,399 votes) |
17 (56,614 votes) |
||||
| Virginia Open Primary |
didn’t qualify for the ballot | 40% (3 delegates) (107,471 votes) |
60% (43 deletates) (158,049 votes) |
didn’t qualify for the ballot | 49 ( 265,520 votes) |
||||
| Mar. 6-10 | Wyoming
County Conventions |
(0 delegate) |
(4 delegates) (0 votes) |
(13 deletates) (0 votes) |
(7 delegates) (0 votes) |
29
( – ) |
|||
| Mar. 10 | Kansas Binding Caucuses |
14% (0 delegates) (4,298 votes) |
13% (0 delegates) (3,767 votes) |
21% (7 delegates) (6,250 votes) |
51% (33 deletates) (15,290 votes) |
40 (29,855 votes ) |
|||
| N. Mariana Islands Convention Caucuses |
3% (0 delegates) (27 votes) |
3% (0 delegates) (28 votes) |
87% (9 deletates) (740 votes) |
6% (0 delegates) (53 votes) |
9 (848 votes) |
||||
| US Virgin Islands Convention Caucuses |
5% (0 delegates) (18 votes) |
29% (1 deletate) (112 votes) |
26% (4 delegates) (101 votes) |
6% (0 delegates) (23 votes) |
9 ( 384 votes ) |
||||
| Guam Convention Caucuses |
0% (0 delegates) (0 votes) |
0% (0 delegates) (0 votes) |
100% (9 deletate) (207 votes) |
0% (0 delegates) (0 votes) |
9 (207) |
||||
| Mar. 13 | Alabama Primary |
29% (12 delegates) (179,917 votes) |
5% (0 delegates) (30,495 votes) |
29% (10 delegates) (178,600 votes) |
35% (16 delegates) (212,341 votes) |
50 (614,945) |
|||
| Hawaii
Caucus |
11% (0 delegates) (1,034 votes) |
18% (0 delegates) (1,712 votes) |
45% (0 delegates) (4,250 votes) |
33% (0 delegates) (2,369 votes) |
20 (9,365) |
||||
| Mississippi Primary |
31% (12 delegates) (88,674 votes) |
4% (0 delegates) (12,499 votes) |
30% (12 delegates) (85,921 votes) |
33% (13 delegates) (93,180 votes) |
40 (283,319) |
||||
| American Samoa Caucus |
n/a% (0 delegates) (n/a votes) |
n/a% (0 delegates) (n/a votes) |
n/a% (6 delegates) (n/a votes) |
n/a% (0 delegates) (n/a votes) |
9 (n/a) |
||||
| Mar. 15-Apr. 10 | Missouri Caucus |
– | – | – | – | 52 ( – ) |
|||
| Mar. 18 | Puerto Rico Caucus |
2% (0 delegates) (2,431 votes) |
1% (0 delegates) (1,452 votes) |
83% (20 delegates) (98,375 votes) |
8% (0 delegates) (9,524 votes) |
23 (118,696) |
|||
| Mar. 20 | Illinois Primary |
7% (0 delegates) (72,942 votes) |
9% (0 delegates) (85,464 votes) |
47% (42 delegates) (428,434 votes) |
35% (12 delegates) (321,079 votes) |
57 (917,046) |
|||
| Mar. 24 | Louisiana Primary |
16% (0 delegates) (29,655 votes) |
6% (0 delegates) (11,460 votes) |
27% (7 delegates) (49,749 votes) |
49% (13 delegates) (91,305 votes) |
20 (186,377) |
|||
| Apr. 3 | Maryland Primary |
10.9% (0 delegates) (25,967 votes) |
9.5% (0 delegates) (22,649 votes) |
49.1% (37 delegates) (116,922 votes) |
28.9% (0 delegates) (68,848 votes) |
37 (2,238,018) |
|||
| Washington, D.C. Primary |
10.7% (0 delegates) (477 votes) |
12% (0 delegates) (535 votes) |
70.2% (18 delegates) (3,122 votes) |
(candidate unable to appear on ballot) |
19 (4,446) |
||||
| Wisconsin
Primary |
6.1% (0 delegates) (43,712 votes) |
11.7% (0 delegates) (83,735 votes) |
42.5% (30 delegates) (304,968 votes) |
37.6% (6 delegates) (269,820 votes) |
42
(715,981) |
||||
| Apr. 24 | Connecticut Primary |
10.3% (0 delegates) (6,038 votes) |
13.4% (0 delegates) (7,904 votes) |
67.5% (28 delegates) (39,691 votes) |
6.9% (0 delegates) (4,035 votes) |
28 (58,816) |
|||
| Delaware Primary |
27.1% (0 delegates) (7,741 votes) |
10.6% (0 delegates) (3,017 votes) |
56.5% (17 delegates) (16,143 votes) |
5.9% (0 delegates) (1,690 votes) |
17 (28,591) |
||||
| New York Primary |
13% (1 delegates) (19,288 votes) |
15.8% (0 delegates) (23,559 votes) |
62.2% (92 delegates) (92,414 votes) |
9% (0 delegates) (13,429 votes) |
95 (148,690) |
||||
| Pennsylvania Primary |
10.6% (0 delegates) (81,693 votes) |
13.2% (0 delegates) (102,061 votes) |
57.8% (2 delegates) (447,371 votes) |
18.5% (0 delegates) (143,134 votes) |
72 (775,172) |
||||
| Rhode Island
Primary |
8.1% (0 delegates) (878 votes) |
23.9% (4 delegates) (3,462 votes) |
63.2% (15 delegates) (9,157 votes) |
5.7% (0 delegates) (823 votes) |
19 (14,489) |
||||
| May 8 | Indiana Primary |
6.4% (0 delegates) (41,087votes) |
15.6% (0 delegates) (99,628 votes) |
64.7% (28 delegates) (413,717 votes) |
13.3% (0 delegates) (85,255 votes) |
46 (639,687) |
|||
| North Carolina Primary |
7.6% (4 delegates) (73,857 votes) |
11.1% (6 delegates) (107,077 votes) |
65.7% (36 delegates) (634,667 votes) |
10.4% (6 delegates) (100,633 votes) |
55 (966,539) |
||||
| West Virginia Primary |
6.3% (0 delegates) (6,986 votes) |
11% (0 delegates) (12,263 votes) |
69.6% (23 delegates) (77,477 votes) |
12.1% (2 delegates) (13,408 votes) |
31 (111,263) |
||||
| May 15 | Nebraska Primary |
5% (0 delegates) (9,519 votes) |
10% (0 delegates) (18,194 votes) |
71% (0 delegates) (129,545 votes) |
14% (0 delegates) (25,534 votes) |
35 (182,807) |
|||
| Oregon Primary |
6% (2 delegates) (6,983 votes) |
13% (3 delegates) (34,227 votes) |
72% (18 delegates) (194,124 votes) |
10% (1 delegates) (25,602 votes) |
28 (271,953) |
||||
| May 22 | Arkansas Primary |
5% (0 delegates) (7,422 votes) |
13% (0 delegates) (20,242 votes) |
68% (33 delegates) (102,932 votes) |
13% (0 delegates) (20,102 votes) |
36 (150,698) |
|||
| Kentucky Primary |
6% (0 delegates) (10,422 votes) |
13% (0 delegates) (22,048 votes) |
67% (42 delegates) (117,398 votes) |
9% (0 delegates) (15,655 votes) |
45 (175,882) |
||||
| May 29 | Texas Primary |
5% (7 delegates) (67,640 votes) |
12% (18 delegates) (171,834 votes) |
69% (105 delegates) (992,289 votes) |
8% (13 delegates) (114,561 votes) |
155 (1,438,563) |
|||
| June 5 | California Primary |
4% (0 delegates) (147,850 votes) |
5% (0 delegates) (11,884 votes) |
80% (169 delegates) (1,150,819 votes) |
5% (0 delegates) (75,784 votes) |
172 (1,446,084) |
|||
| Montana Primary |
4% (0 delegates) (5,815 votes) |
14% (0 delegates) (19.167 votes) |
68% (25 delegates) (92,017 votes) |
9% (0 delegates) (12,063 votes) |
26 (134,377) |
||||
| New Jersey Primary |
3% (0 delegates) (7,089 votes) |
10% (0 delegates) (23,597 votes) |
82% (50 delegates) (184,577 votes) |
5% (0 delegates) (11,884 votes) |
50 (227,147) |
||||
| New Mexico Primary |
6% (0 delegates) (5,364 votes) |
10% (0 delegates) (9,497 votes) |
73% (20 delegates) (67,295 votes) |
10% (0 delegates) (9,661 votes) |
23 (91,817) |
||||
| South Dakota
Primary |
4% (0 delegates) (2,071 votes) |
14% (0 delegates) (19,167 votes) |
66% (25 delegates) (34,035 votes) |
11% (0 delegates) (5,917 votes) |
28 (51,527) |
||||
| June 26 | Utah Primary |
– | – | 40 ( – ) |
|||||
| Withdraw date | 5/2/2012 | – | – | 4/10/2012 | |||||
| Color key: | 1st place | 2nd place | 3rd place | Candidate has withdrawn |
Candidate unable to appear on ballot |
Candidate unable to receive full delegate support |
( – )
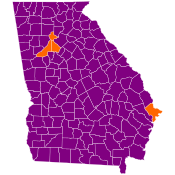
2012 Republican Primary Results By State

2012 Republican primary results by state
|
Mitt Romney (41)
Rick Santorum (11)
|
Newt Gingrich (2)
Ron Paul (1)
|
Iowa Caucus Results
Caucus date: January 3, 2012
National delegates: 28

Iowa results by county
| Iowa Republican caucuses, January 3, 2012 | ||||||
|---|---|---|---|---|---|---|
| Candidate | Votes | Percentage | Projected delegate count | |||
| AP |
CNN |
MSNBC |
||||
| 29,839 | 24.56% | 12 | 7 | 11 | ||
| Mitt Romney | 29,805 | 24.54% | 13 | 7 | 11 | |
| Ron Paul | 26,036 | 21.43% | 0 | 7 | 3 | |
| Newt Gingrich | 16,163 | 13.31% | 0 | 2 | 0 | |
| Rick Perry | 12,557 | 10.34% | 0 | 2 | 0 | |
| Michele Bachmann | 6,046 | 4.98% | 0 | 0 | 0 | |
| Jon Huntsman | 739 | 0.61% | 0 | 0 | 0 | |
| No Preference | 147 | 0.12% | 0 | 0 | 0 | |
| Other | 85 | 0.07% | 0 | 0 | 0 | |
| Herman Cain | 45 | 0.04% | 0 | 0 | 0 | |
| Buddy Roemer | 17 | 0.01% | 0 | 0 | 0 | |
| Unprojected delegates: | 3 | 3 | 3 | |||
| Total: | 121,479 | 100.0% | 28 | 28 | 28 | |
New Hampshire Primary Results
Primary date: January 10, 2012
National delegates: 12

New Hampshire results by county
| New Hampshire Republican primary, January 10, 2012 | |||||||
|---|---|---|---|---|---|---|---|
| Candidate | Votes | Percentage | Projected delegate count | ||||
| FOX | CNN | MSNBC | |||||
| 97,600 | 39.28% | 7 | 7 | 7 | |||
| Ron Paul | 56,872 | 22.89% | 3 | 3 | 3 | ||
| Jon Huntsman | 41,783 | 16.89% | 2 | 2 | 2 | ||
| Rick Santorum | 23,362 | 9.43% | 0 | 0 | 0 | ||
| Newt Gingrich | 23,291 | 9.42% | 0 | 0 | 0 | ||
| Rick Perry | 1,764 | 0.71% | 0 | 0 | 0 | ||
| Buddy Roemer | 950 | 0.38% | 0 | 0 | 0 | ||
| Michele Bachmann | 350 | 0.14% | 0 | 0 | 0 | ||
| Fred Karger | 345 | 0.14% | 0 | 0 | 0 | ||
| Kevin Rubash | 250 | 0.10% | 0 | 0 | 0 | ||
| Gary Johnson | 181 | 0.07% | 0 | 0 | 0 | ||
| Herman Cain | 161 | 0.06% | 0 | 0 | 0 | ||
| Jeff Lawman | 119 | 0.05% | 0 | 0 | 0 | ||
| Christopher Hill | 108 | 0.04% | 0 | 0 | 0 | ||
| Other | 682 | 0.27% | 0 | 0 | 0 | ||
| Unprojected delegates: | 0 | 0 | 0 | ||||
| Total: | 248,448 | 100.0% | 12 | 12 | 12 | ||
- Other includes write-in’s and candidates with less than 100 votes.
South Carolina Primary Results
Primary date: January 21, 2012
National delegates: 25

South Carolina results by county
| South Carolina Republican primary, January 21, 2012 |
|||||
|---|---|---|---|---|---|
| Candidate | Votes | Percentage | Projected delegate count | ||
| CNN | FOX | AP | |||
| 243,153 | 40.4% | 23 | 23 | 23 | |
| Mitt Romney | 167,279 | 27.8% | 2 | 2 | 2 |
| Rick Santorum | 102,055 | 16.97% | 0 | 0 | 0 |
| Ron Paul | 77,993 | 12.98% | 0 | 0 | 0 |
| Herman Cain(withdrawn) | 6,324 | 1.05% | 0 | 0 | 0 |
| Rick Perry(withdrawn) | 2,494 | <1% | 0 | 0 | 0 |
| Jon Huntsman(withdrawn) | 1,161 | <1% | 0 | 0 | 0 |
| Michelle Bachmann(withdrawn) | 494 | <1% | 0 | 0 | 0 |
| Gary Johnson(withdrawn) | 213 | <1% | 0 | 0 | 0 |
| Unprojected delegates: | 0 | 0 | 0 | ||
| Total: | 601,166 | 100.0% | 25 | 25 | 25 |
Florida Primary Results
Primary date: January 31, 2012
National delegates: 50
Closed primary 4,063,853 registered Republicans

Florida results by county
| Florida Republican primary, January 31, 2012 | |||||
|---|---|---|---|---|---|
| Candidate | Votes | Percentage | Projected delegate count | ||
| Source 1 | Source 2 | Source 3 | |||
| 775,014 | 46% | 50* | 50* | 50* | |
| Newt Gingrich | 533,117 | 32% | 0 | 0 | 0 |
| Rick Santorum | 222,798 | 13% | 0 | 0 | 0 |
| Ron Paul | 117,105 | 7% | 0 | 0 | 0 |
| Rick Perry (withdrawn) | 6,768 | 0.41% | 0 | 0 | 0 |
| Jon Huntsman (withdrawn) | 6,198 | 0.37% | 0 | 0 | 0 |
| Michele Bachmann (withdrawn) | 3,959 | 0.24% | 0 | 0 | 0 |
| Herman Cain (withdrawn) | 3,494 | 0.21% | 0 | 0 | 0 |
| Gary Johnson (withdrawn) | 1,196 | 0.07% | 0 | 0 | 0 |
| Unprojected delegates: | 50 | 50 | 50 | ||
| Total: | 1,669,649 | 100.0% | 50 | 50 | 50 |
*(Newt Gingrich has challenged the results of the Florida Republican presidential primary based on the Republican National Committee’s own rules which state that no contest can be winner-take-all prior to April 1, 2012.)
Nevada Caucus
Caucus date: February 4, 2012
National delegates: 28
Closed caucus: 400,310 registered Republicans (Jan. 2012)

Nevada results by county
| Nevada Republican caucuses, February 4, 2012 | |||||||
|---|---|---|---|---|---|---|---|
| Candidate | Votes | Percentage | Projected delegate count | ||||
| CNN |
MSNBC |
Fox News |
|||||
| 16,486 | 50% | 14 | 13 | 10 | |||
| Newt Gingrich | 6,956 | 21.1% | 6 | 5 | 4 | ||
| Ron Paul | 6,175 | 18.7% | 5 | 5 | 3 | ||
| Rick Santorum | 3,277 | 9.9% | 3 | 2 | 2 | ||
| Other | |||||||
| Unprojected delegates: | 0 | 3 | 9 | ||||
| Total: | 32,894 | 100.0% | 28 | 28 | 28 | ||
Colorado Caucus
Caucus date: February 7, 2012
National delegates: 36
Nonbinding caucus:

Colorado results by county
| Colorado Republican caucuses, February 7, 2012 | |||||||
|---|---|---|---|---|---|---|---|
| Candidate | Votes | Percentage | Projected delegate count | ||||
| USA Today |
CNN |
||||||
| 26,614 | 40.31% | 18 | 17 | ||||
| Mitt Romney | 23,012 | 34.85% | 9 | 13 | |||
| Newt Gingrich | 8,445 | 12.79% | 0 | 2 | |||
| Ron Paul | 7,759 | 11.75% | 0 | 1 | |||
| Other | 197 | 0.3% | |||||
| Unprojected delegates: | 9 | 3 | |||||
| Total: | 66,027 | 100.0% | 36 | 36 | |||
Missouri Primary
Primary date: February 7, 2012
National delegates: 0, There are no delegates from this primary. Missouri awards delegates March 17 with a caucus.
Primary:

Missouri results by county
| Missouri Republican caucus, February 7, 2012 | |||||||
|---|---|---|---|---|---|---|---|
| Candidate | Votes | Percentage | |||||
| 138,957 | 55.2% | ||||||
| Mitt Romney | 63,826 | 25.3% | |||||
| Ron Paul | 30,641 | 12.2% | |||||
| Uncommitted | 9,859 | 3.95 | |||||
| Rick Perry | 2,463 | 1% | |||||
| Herman Cain | 2,314 | .9% | |||||
| Michele Bachmann | 1,690 | .7% | |||||
| Jon Huntsman | 1,045 | .4% | |||||
| Gary Johnson | 547 | .2% | |||||
| Michael J. Meehan | 364 | .1% | |||||
| Keith Drummond | 162 | .1% | |||||
| Total: | 251,868 | 100.0% | |||||
Minnesota Caucus
Caucus date: February 7, 2012
National delegates: 40
Nonbinding caucus:

Minnesota results by county
| Minnesota Republican caucuses, February 7, 2012 | |||||||
|---|---|---|---|---|---|---|---|
| Candidate | Votes | Percentage | Projected delegate count | ||||
| USA Today |
CNN |
||||||
| 21,985 | 45% | 37 | 6 | ||||
| Ron Paul | 13,258 | 27.1% | 0 | 4 | |||
| Mitt Romney | 8,231 | 16.8% | 0 | 2 | |||
| Newt Gingrich | 5,276 | 10.8% | 0 | 2 | |||
| Write Ins | 143 | .3% | 0 | 0 | |||
| Unprojected delegates: | 3 | 26 | |||||
| Total: | 48,893 | 100.0% | 40 | 40 | |||
Maine Caucus
Caucus date: February 4-12, 2012
National delegates: 24
Nonbinding caucus:

Maine results by county
| Maine Republican caucuses, February 4-12, 2012 | |||||
|---|---|---|---|---|---|
| Candidate | Votes | Percentage | Projected delegate count | ||
| AP |
CNN |
||||
| 2,269 | 39.03% | 11 | 11 | ||
| Ron Paul | 2,030 | 34.92% | 10 | 7 | |
| Rick Santorum | 1.052 | 18.09% | 0 | 3 | |
| Newt Gingrich | 391 | 6.73% | 0 | 0 | |
| Other | 72 | 1.1% | 0 | 0 | |
| Unprojected delegates: | 3 | 5 | |||
| Total: | 5,814 | 100.0% | 24 | 24 | |
Arizona Primary
Caucus date: February 28, 2012
National delegates: 29
Closed Primary:

Arizona results by county
| Arizona Republican primary, February 28, 2012 | |||||||
|---|---|---|---|---|---|---|---|
| Candidate | Votes | Percentage | Projected delegate count | ||||
| AP |
CNN |
MSNBC |
|||||
| 216,805 | 47.27% | 29 | 29 | 29 | |||
| Rick Santorum | 122,088 | 26.62% | 0 | 0 | 0 | ||
| Newt Gingrich | 74,110 | 16.16% | 0 | 0 | 0 | ||
| Ron Paul | 38,753 | 8.45% | 0 | 0 | 0 | ||
| Rick Perry | 1,871 | .41% | 0 | 0 | 0 | ||
| Others | 5,004 | 1.09% | 0 | 0 | 0 | ||
| Unprojected delegates: | 0 | 0 | 0 | ||||
| Total: | 458,631 | 100.0% | 29 | 29 | 29 | ||
Michagan Primary
Caucus date: February 28, 2012
National delegates: 30
Open Primary:

Michigan results by county
| Michagan Republican primary, February 28, 2012 | |||||||
|---|---|---|---|---|---|---|---|
| Candidate | Votes | Percentage | Projected delegate count | ||||
| AP |
CNN |
MSNBC |
|||||
| 409,120 | 41.07% | 15 | 15 | 15 | |||
| Rick Santorum | 377,144 | 37.86% | 13 | 13 | 13 | ||
| Ron Paul | 115,778 | 11.62% | 0 | 0 | 0 | ||
| Newt Gingrich | 65,002 | 6.53% | 0 | 0 | 0 | ||
| Uncommitted | 18,843 | 1.89% | 0 | 0 | 0 | ||
| Rick Perry | 1,906 | .19% | 0 | 0 | 0 | ||
| Buddy Roemer | 1,874 | .19% | 0 | 0 | 0 | ||
| Michele Bachmann | 1,766 | .18% | 0 | 0 | 0 | ||
| Jon Huntsman | 1,712 | .17% | 0 | 0 | 0 | ||
| Herman Cain | 1,237 | .12% | 0 | 0 | 0 | ||
| Fred Karger | 1,225 | .12% | 0 | 0 | 0 | ||
| Gary Johnson | 519 | .05% | 0 | 0 | 0 | ||
| Unprojected delegates: | 0 | 0 | 0 | ||||
| Total: | 996,126 | 100.0% | 30 | 30 | 30 | ||
Wyoming Caucus
Caucus date: February 11-29, 2012
National delegates: 29
Nonbinding caucus:

Wyoming results by county
| Wyoming Republican caucuses, February 11-29, 2012 | |||||||
|---|---|---|---|---|---|---|---|
| Candidate | Votes | Percentage | Projected delegate count | ||||
| AP |
CNN |
MSNBC |
|||||
| 822 | 38.9 | 11 | |||||
| Rick Santorum | 673 | 31.9% | 9 | ||||
| Ron Paul | 439 | 20.8% | 6 | ||||
| Newt Gingrich | 165 | 7.8% | 1 | ||||
| Other | 9 | .43% | |||||
| Unprojected delegates: | 29 | 2 | 29 | ||||
| Total: | 2,108 | 100.0% | 29 | 29 | 29 | ||
Washington Caucus
Caucus date: March 3, 2012
National delegates: 43
Nonbinding caucus:

Washington results by county
| Washington Republican caucuses, March 3, 2012 | |||||||
|---|---|---|---|---|---|---|---|
| Candidate | Votes | Percentage | Projected delegate count | ||||
| AP |
CNN |
MSNBC |
|||||
| 19,111 | 37.65% | 30 | 25 | 30 | |||
| Ron Paul | 12,594 | 24.81% | 5 | 8 | 5 | ||
| Rick Santorum | 12,089 | 23.81% | 5 | 7 | 5 | ||
| Newt Gingrich | 5,221 | 10.28% | 0 | 0 | |||
| Uncommitted | 1,656 | 3.26% | 0 | 0 | |||
| Write Ins | 93 | .18% | 0 | 0 | |||
| Unprojected delegates: | 3 | 3 | 3 | ||||
| Total: | 50,764 | 100.0% | 43 | 43 | 43 | ||
Alaska Caucus
Caucus date: Super Tuesday March 6, 2012
National delegates: 27
Binding caucus:
| Alaska Republican caucuses, March 6, 2012 | |||||||
|---|---|---|---|---|---|---|---|
| Candidate | Votes | Percentage | Projected delegate count | ||||
| AP |
CNN |
MSNBC |
|||||
| 4285 | 33.2% | 0 | 8 | 8 | |||
| Rick Santorum | 3860 | 29.9% | 0 | 7 | 7 | ||
| Ron Paul | 3175 | 24.6% | 0 | 6 | 6 | ||
| Newt Gingrich | 1865 | 14.4% | 0 | 3 | 3 | ||
| Unprojected delegates: | 27 | 3 | 3 | ||||
| Total: | 12,926 | 100.0% | 27 | 27 | 27 | ||
Georgia Primary
Caucus date: Super Tuesday March 6, 2012
National delegates: 76
Modified Primary:
Georgia results by county
| Georgia Republican Primary, March 6, 2012 | |||||||
|---|---|---|---|---|---|---|---|
| Candidate | Votes | Percentage | Projected delegate count | ||||
| AP |
CNN |
MSNBC |
|||||
| 424,976 | 48.3% | 0 | 53 | 47 | |||
| Mitt Romney | 233,297 | 26.5% | 0 | 20 | 15 | ||
| Rick Santorum | 176,080 | 20% | 0 | 3 | 3 | ||
| Ron Paul | 58,982 | 6.7% | 0 | 0 | 0 | ||
| Jon Huntsman | 1,812 | .2% | 0 | 0 | 0 | ||
| Michele Bachmann | 1,712 | .19% | 0 | 0 | 0 | ||
| Rick Perry | 1,694 | .19% | 0 | 0 | 0 | ||
| Unprojected delegates: | 76 | 0 | 11 | ||||
| Total: | 898,553 | 100.0% | 76 | 76 | 76 | ||
Idaho Caucus
Caucus date: Super Tuesday March 6, 2012
National delegates: 32
Binding caucus:

Idaho results by county
| Idaho Republican caucuses, March 6, 2012 | |||||||
|---|---|---|---|---|---|---|---|
| Candidate | Votes | Percentage | Projected delegate count | ||||
| AP |
CNN |
MSNBC |
|||||
| 27,514 | 63.2% | 0 | 32 | 32 | |||
| Ron Paul | 7,590 | 17.4% | 0 | 0 | 0 | ||
| Rick Santorum | 7,441 | 17.1% | 0 | 0 | 0 | ||
| Newt Gingrich | 940 | 2.2% | 0 | 0 | 0 | ||
| Unprojected delegates: | 32 | 0 | 0 | ||||
| Total: | 43,502 | 100.0% | 32 | 32 | 32 | ||
Massachusetts Primary
Caucus date: Super Tuesday March 6, 2012
National delegates: 41
Modified Primary:

Massachusetts results by county
| Massachusetts Republican primary, March 6, 2012 | |||||||
|---|---|---|---|---|---|---|---|
| Candidate | Votes | Percentage | Projected delegate count | ||||
| AP |
CNN |
MSNBC |
|||||
| 265,110 | 72.5% | 0 | 38 | 38 | |||
| Ron Paul | 44,255 | 12.1% | 0 | 0 | 0 | ||
| Rick Santorum | 35,037 | 9.58% | 0 | 0 | 0 | ||
| Newt Gingrich | 16,990 | 4.64% | 0 | 0 | 0 | ||
| Jon Huntsman | 2,249 | 0.61% | 0 | 0 | 0 | ||
| Rick Perry | 1,024 | 0.28% | 0 | 0 | 0 | ||
| Michele Bachmann | 913 | 0.24% | 0 | 0 | 0 | ||
| Unprojected delegates: | 41 | 3 | 3 | ||||
| Total: | 365,578 | 100.0% | 41 | 41 | 41 | ||
North Dakota Caucus
Caucus date: Super Tuesday March 6, 2012
National delegates: 28
Binding Caucus:
| North Dakota Republican caucus, March 6, 2012 | |||||||
|---|---|---|---|---|---|---|---|
| Candidate | Votes | Percentage | Projected delegate count | ||||
| AP |
CNN |
MSNBC |
|||||
| 4,510 | 39.7% | 11 | 11 | 11 | |||
| Ron Paul | 3,186 | 28.1% | 8 | 8 | 8 | ||
| Mitt Romney | 2,691 | 23.7% | 7 | 7 | 7 | ||
| Newt Gingrich | 962 | 8.5% | 2 | 2 | 2 | ||
| Unprojected delegates: | 0 | 0 | 0 | ||||
| Total: | 11,349 | 100.0% | 28 | 28 | 28 | ||
Ohio Primary
Primary date: Super Tuesday March 6, 2012
National delegates: 66
Modified Primary:

Ohio results by county
| Ohio Republican primary, March 6, 2012 | |||||||
|---|---|---|---|---|---|---|---|
| Candidate | Votes | Percentage | Projected delegate count | ||||
| AP |
CNN |
MSNBC |
|||||
| 456,513 | 37.93% | 0 | 35 | 35 | |||
| Rick Santorum | 446,225 | 37.08% | 0 | 19 | 21 | ||
| Newt Gingrich | 175,554 | 14.58% | 0 | 0 | 0 | ||
| Ron Paul | 111,238 | 9.24% | 0 | 0 | 0 | ||
| Rick Perry | 7,445 | 0.61% | 0 | 0 | 0 | ||
| Jon Huntsman | 6,428 | 0.53% | 0 | 0 | 0 | ||
| Unprojected delegates: | 66 | 12 | 10 | ||||
| Total: | 1,203,403 | 100.0% | 66 | 66 | 66 | ||
Oklahoma Primary
Primary date: Super Tuesday March 6, 2012
National delegates: 43
Closed Primary:

Oklahoma results by county
| Oklahoma Republican primary, March 6, 2012 | |||||||
|---|---|---|---|---|---|---|---|
| Candidate | Votes | Percentage | Projected delegate count | ||||
| AP |
CNN |
MSNBC |
|||||
| 96,759 | 33.79% | 0 | 14 | 14 | |||
| Mitt Romney | 80,291 | 28.04% | 0 | 13 | 13 | ||
| Newt Gingrich | 78,686 | 27.48% | 0 | 13 | 13 | ||
| Ron Paul | 27,572 | 9.63% | 0 | 0 | 0 | ||
| Rick Perry | 1,290 | 0.45% | 0 | 0 | |||
| Michele Bachmann | 951 | 0.33% | 0 | 0 | |||
| Jon Huntsman | 749 | 0.26% | 0 | 0 | |||
| Unprojected delegates: | 43 | 3 | 3 | ||||
| Total: | 286,298 | 100.0% | 43 | 43 | 43 | ||
Tennessee Primary
Primary date: Super Tuesday March 6, 2012
National delegates: 58
Open Primary:

Tennessee results by county
| Tennessee Republican primary, March 6, 2012 | |||||||
|---|---|---|---|---|---|---|---|
| Candidate | Votes | Percentage | Projected delegate count | ||||
| NYT |
CNN |
FOX |
|||||
| 205,012 | 37.15% | 29 | 27 | 26 | |||
| Mitt Romney | 154,911 | 28.07% | 14 | 15 | 12 | ||
| Newt Gingrich | 132,072 | 23.93% | 9 | 8 | 9 | ||
| Ron Paul | 49,801 | 9.02% | 0 | 0 | 0 | ||
| Rick Perry | 1,953 | 0.35% | 0 | 0 | 0 | ||
| Michele Bachmann | 1,874 | 0.33% | 0 | 0 | 0 | ||
| Jon Huntsman | 1,230 | 0.22% | 0 | 0 | 0 | ||
| Buddy Roemer | 877 | 0.15% | 0 | 0 | 0 | ||
| Gary Johnson | 571 | 0.1% | 0 | 0 | 0 | ||
| Uncommited | 3,492 | 0.63% | 0 | 0 | 0 | ||
| Unprojected delegates: | 6 | 8 | 9 | ||||
| Total: | 551,793 | 100.0% | 58 | 58 | 58 | ||
Vermont Primary
Primary date: Super Tuesday March 6, 2012
National delegates: 17
Open Primary:

Vermont results by county
| Vermont Republican primary, March 6, 2012 | |||||||
|---|---|---|---|---|---|---|---|
| Candidate | Votes | Percentage | Projected delegate count | ||||
| NYT |
CNN |
FOX |
|||||
| 23,965 | 39.74% | 9 | 9 | 9 | |||
| Ron Paul | 15,369 | 25.48% | 4 | 4 | 4 | ||
| Rick Santorum | 14,273 | 23.66% | 4 | 4 | 4 | ||
| Newt Gingrich | 4,944 | 8.19% | 0 | 0 | 0 | ||
| Jon Huntsman | 1,210 | 2% | 0 | 0 | 0 | ||
| Rick Perry | 543 | 0.90% | 0 | 0 | 0 | ||
| Unprojected delegates: | 0 | 0 | 0 | ||||
| Total: | 60,304 | 100.0% | 17 | 17 | 17 | ||
Virginia Primary
Primary date: Super Tuesday March 6, 2012
National delegates: 49
Open Primary:

Virginia results by county
| Virginia Republican primary, March 6, 2012 | |||||||
|---|---|---|---|---|---|---|---|
| Candidate | Votes | Percentage | Projected delegate count | ||||
| AP |
CNN |
FOX |
|||||
| 158,051 | 59.5% | 43 | 43 | 43 | |||
| Ron Paul | 107,470 | 40.5% | 3 | 3 | 3 | ||
| Unprojected delegates: | 3 | 3 | 3 | ||||
| Total: | 265,521 | 100.0% | 49 | 49 | 49 | ||
Kansas Caucuses
Primary date: March 10, 2012
National delegates: 40
Caucuses:

Kansas results by county
| Kansas Republican caucuses, March 10, 2012 | |||||||
|---|---|---|---|---|---|---|---|
| Candidate | Votes | Percentage | Projected delegate count | ||||
| AP |
CNN |
FOX |
|||||
| 15,271 | 51.2% | 33 | 33 | ||||
| Mitt Romney | 6,242 | 20.9% | 7 | 7 | |||
| Newt Gingrich | 4,294 | 14.4% | 0 | 0 | |||
| Ron Paul | 3,760 | 12.6% | 0 | 0 | |||
| Herman Cain | 39 | 0.1% | |||||
| Jon Huntsman | 38 | 0.1% | |||||
| Rick Perry | 37 | 0.1% | |||||
| Michelle Bachmann | 16 | 0.1% | |||||
| Uncommitted | 120 | 0.4% | |||||
| Unprojected delegates: | 0 | 0 | 40 | ||||
| Total: | 28,996 | 100.0% | 40 | 40 | 40 | ||
N. Marianna Islands Caucuses
Primary date: March 10, 2012
National delegates: 9
Caucuses:
| N. Marianna Islands Republican caucuses, March 10, 2012 | |||||||
|---|---|---|---|---|---|---|---|
| Candidate | Votes | Percentage | Projected delegate count | ||||
| AP |
CNN |
FOX |
|||||
| 740 | 87.25% | ||||||
| Rick Santorum | 53 | 6.25% | |||||
| Ron Paul | 28 | 3.3% | |||||
| Newt Gingrich | 27 | 3.18% | |||||
| Unprojected delegates: | 9 | 9 | 9 | ||||
| Total: | 848 | 100.0% | 9 | 9 | 9 | ||
U.S. Virgin Islands
Primary date: March 10, 2012
National delegates: 9
Caucuses:
| U.S. Virgin Islands Republican caucuses, March 10, 2012 | |||||||
|---|---|---|---|---|---|---|---|
| Candidate | Votes | Percentage | Projected delegate count | ||||
| NYT |
CNN |
FOX |
|||||
| 112 | 29.16% | 1 | |||||
| Mitt Romney | 101 | 26.30% | 7 | ||||
| Rick Santorum | 23 | 5.98% | 0 | ||||
| Newt Gingrich | 18 | 4.68% | 0 | ||||
| Uncommitted | 130 | 33.85 | |||||
| Unprojected delegates: | 1 | 0 | 0 | ||||
| Total: | 384 | 100.0% | 9 | 9 | 9 | ||
Guam
Caucus date: March 10, 2012
National delegates: 9
Convention Caucuses:
| Guam Republican caucuses, March 10, 2012 | |||||||
|---|---|---|---|---|---|---|---|
| Candidate | Votes | Percentage | Projected delegate count | ||||
| AP |
CNN |
FOX |
|||||
| 207 | 100% | 9 | |||||
| Rick Santorum | 0 | 0% | |||||
| Ron Paul | 0 | 0% | |||||
| Newt Gingrich | 0 | 0% | |||||
| Unprojected delegates: | 0 | 9 | 9 | ||||
| Total: | 207 | 100.0% | 9 | 9 | 9 | ||
Alabama
Primary date: March 13, 2012
National delegates: 50
Primary:

Alabama results by county
| Alabama Republican primary, March 13, 2012 | |||||||
|---|---|---|---|---|---|---|---|
| Candidate | Votes | Percentage | Projected delegate count | ||||
| AP |
CNN |
FOX |
|||||
| 212,343 | 34.5% | 18 | 19 | ||||
| Newt Gingrich | 179,919 | 29.3% | 12 | 9 | |||
| Mitt Romney | 178,601 | 29% | 11 | 9 | |||
| Ron Paul | 30,494 | 5% | |||||
| Rick Perry | 1,810 | ||||||
| Michele Bachmann | 1,660 | ||||||
| Jon Huntsman | 1,030 | ||||||
| Unprojected delegates: | 9 | 13 | 50 | ||||
| Total: | 614,945 | 100.0% | 50 | 50 | 50 | ||
Hawaii
Primary date: March 13, 2012
National delegates: 20
Binding Caucuses:

Hawaii results by county
| Hawaii Republican caucuses, March 13, 2012 | |||||||
|---|---|---|---|---|---|---|---|
| Candidate | Votes | Percentage | Projected delegate count | ||||
| AP |
CNN |
FOX |
|||||
| 4,250 | 45.4% | 9 | |||||
| Rick Santorum | 2,369 | 25.3% | 5 | ||||
| Ron Paul | 1,712 | 18.3% | 3 | ||||
| Newt Gingrich | 1,034 | 11% | |||||
| Unprojected delegates: | 3 | 20 | 20 | ||||
| Total: | 9,365 | 100.0% | 20 | 20 | 20 | ||
Mississippi
Primary date: March 13, 2012
National delegates: 40
Primary:

Mississippi results by county
| Mississippi Republican caucuses, March 13, 2012 | |||||||
|---|---|---|---|---|---|---|---|
| Candidate | Votes | Percentage | Projected delegate count | ||||
| AP |
CNN |
FOX |
|||||
| 93,182 | 32.9% | 13 | 13 | ||||
| Newt Gingrich | 88,676 | 31.3% | 12 | 13 | |||
| Mitt Romney | 85,922 | 30.3% | 12 | 12 | |||
| Ron Paul | 12,498 | 4.4% | |||||
| Other | |||||||
| Unprojected delegates: | 3 | 2 | 40 | ||||
| Total: | 283,319 | 100.0% | 40 | 40 | 40 | ||
American Samoa
Primary date: March 13, 2012
National delegates: 9
Caucuses:
| American Samoa Republican caucuses, March 13, 2012 | |||||||
|---|---|---|---|---|---|---|---|
| Candidate | Votes | Percentage | Projected delegate count | ||||
| AP |
CNN |
FOX |
|||||
| 6 | 6 | 6 | |||||
| Ron Paul | |||||||
| Rick Santorum | |||||||
| Newt Gingrich | |||||||
| Unprojected delegates: | 3 | 3 | 3 | ||||
| Total: | 70 | 100.0% | 9 | 9 | 9 | ||
Puerto Rico
Primary date: March 18, 2012
National delegates: 23
Primary:
| Puerto Rico Republican caucuses, March 18, 2012 | |||||||
|---|---|---|---|---|---|---|---|
| Candidate | Votes | Percentage | Projected delegate count | ||||
| AP |
CNN |
FOX |
|||||
| 99,009 | 82.9% | 20 | 20 | 20 | |||
| Rick Santorum | 9,561 | 8% | |||||
| Buddy Roemer | 2,638 | 2.2% | |||||
| Newt Gingrich | 2,442 | 2.1% | |||||
| Fred Karger | 1,711 | 1.4% | |||||
| Ron Paul | 1,465 | 1.2% | |||||
| Other | 2,602 | 2.2% | |||||
| Unprojected delegates: | 3 | 3 | 3 | ||||
| Total: | 119,428 | 100.0% | 23 | 23 | 23 | ||
Illinois
Primary date: March 20, 2012
National delegates: 54
Primary:

Illinois results by county
| Illinois Republican caucuses, March 20, 2012 | |||||||
|---|---|---|---|---|---|---|---|
| Candidate | Votes | Percentage | Projected delegate count | ||||
| AP |
CNN |
FOX |
|||||
| 428,434 | 46.7%% | 42 | 41 | 42 | |||
| Rick Santorum | 321,079 | 35% | 12 | 10 | 12 | ||
| Ron Paul | 85,464 | 9.3% | 0 | 0 | 0 | ||
| Newt Gingrich | 72,942 | 7.95% | 0 | 0 | 0 | ||
| Rick Perry | 5,475 | .60% | |||||
| Buddy Roemer | 3,652 | .40% | |||||
| Unprojected delegates: | 0 | 3 | 0 | ||||
| Total: | 917,046 | 100.0% | 54 | 54 | 54 | ||
Louisiana
Primary date: March 24, 2012
National delegates: 46
Primary:

Louisiana results by parish
| Louisiana Republican primary, March 24, 2012 | |||||||
|---|---|---|---|---|---|---|---|
| Candidate | Votes | Percentage | Projected delegate count | ||||
| AP |
CNN |
FOX |
|||||
| 91,305 | 48.99% | 10 | 10 | ||||
| Mitt Romney | 48,749 | 26.69% | 5 | 5 | |||
| Newt Gingrich | 29,655 | 15.91% | |||||
| Ron Paul | 11,460 | 6.15% | |||||
| Buddy Roemer | 2,203 | 1.18% | |||||
| Rick Perry | 955 | 0.51% | |||||
| Michele Bachmann | 622 | 0.33% | |||||
| Jon Huntsman | 242 | 0.13% | |||||
| Randy Crow | 186 | 0.10% | |||||
| Unprojected delegates: | 5 | 5 | 20 | ||||
| Total: | 186,377 | 100.0% | 20 | 20 | 20 | ||
Maryland
Primary date: April 3, 2012
National delegates: 37
Primary:

Maryland results by county
| Maryland Republican primary, April 3, 2012 | |||||||
|---|---|---|---|---|---|---|---|
| Candidate | Votes | Percentage | Projected delegate count | ||||
| AP |
CNN |
FOX |
|||||
| 116,922 | 49.1% | 37 | 31 | ||||
| Rick Santorum | 68,848 | 28.9% | |||||
| Newt Gingrich | 25,967 | 10.9% | |||||
| Ron Paul | 22,649 | 9.5% | |||||
| Jon Huntsman | 1,393 | 0.6% | |||||
| Rick Perry | 1,037 | 0.4% | |||||
| Buddy Roemer | 854 | 0.4% | |||||
| Fred Karger | 348 | 0.1% | |||||
| Unprojected delegates: | 0 | 6 | 37 | ||||
| Total: | 2,238,018 | 100.0% | 37 | 37 | 37 | ||
Washington D.C.
Primary date: April 3, 2012
National delegates: 19
Primary:

District of Columbia results by county
| Washington D.C. Republican primary, April 3, 2012 | |||||||
|---|---|---|---|---|---|---|---|
| Candidate | Votes | Percentage | Projected delegate count | ||||
| AP |
CNN |
FOX |
|||||
| 3,122 | 70.2% | 18 | 16 | ||||
| Ron Paul | 535 | 12% | |||||
| Newt Gingrich | 477 | 10.7% | |||||
| Jon Huntsman | 312 | 7% | |||||
| Unprojected delegates: | 1 | 3 | 19 | ||||
| Total: | 4,446 | 100.0% | 19 | 19 | 19 | ||
Wisconsin
Primary date: April 3, 2012
National delegates: 42
Primary:

Wisconsin results by county
| Wisconsin Republican primary, April 3, 2012 | |||||||
|---|---|---|---|---|---|---|---|
| Candidate | Votes | Percentage | Projected delegate count | ||||
| AP |
CNN |
FOX |
|||||
| 304,968 | 42.5% | 30 | 30 | ||||
| Rick Santorum | 269,820 | 37.6% | 6 | ||||
| Ron Paul | 83,735 | 11.7% | |||||
| Newt Gingrich | 43,712 | 6.1% | |||||
| Michele Bachmann | 5,785 | 0.8% | |||||
| Jon Huntsman | 4,913 | 0.7% | |||||
| Others | 4,048 | 0.6% | |||||
| Unprojected delegates: | 6 | 12 | 42 | ||||
| Total: | 715,981 | 100.0% | 42 | 42 | 42 | ||
Connecticut
Primary date: April 24, 2012
National delegates: 28
Primary:
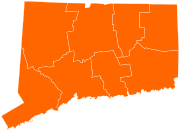
Connecticut results by county
| Connecticut Republican primary, April 24, 2012 | |||||||
|---|---|---|---|---|---|---|---|
| Candidate | Votes | Percentage | Projected delegate count | ||||
| AP |
CNN |
FOX |
|||||
| 39,691 | 67.5% | 28 | 28 | ||||
| Ron Paul | 7,904 | 13.4% | |||||
| Newt Gingrich | 6,038 | 10.3% | |||||
| Rick Santorum | 4,035 | 6.9% | |||||
| Other | 2.0% | ||||||
| Unprojected delegates: | 28 | 28 | 28 | ||||
| Total: | 58,816 | 100.0% | 28 | 28 | 28 | ||
Delaware
Primary date: April 24, 2012
National delegates: 17
Primary:

Delaware results by county
| Delaware Republican primary, April 24, 2012 | |||||||
|---|---|---|---|---|---|---|---|
| Candidate | Votes | Percentage | Projected delegate count | ||||
| AP |
CNN |
FOX |
|||||
| 16,143 | 56.5% | 17 | 17 | ||||
| Newt Gingrich | 7,741 | 27.1% | |||||
| Ron Paul | 3,017 | 10.6% | |||||
| Rick Santorum | 1,690 | 5.9% | |||||
| Other | |||||||
| Unprojected delegates: | 17 | 17 | 17 | ||||
| Total: | 28,591 | 100.0% | 17 | 17 | 17 | ||
New York
Primary date: April 24, 2012
National delegates: 95
Primary:

New York results by county
| New York Republican primary, April 24, 2012 | |||||||
|---|---|---|---|---|---|---|---|
| Candidate | Votes | Percentage | Projected delegate count | ||||
| AP |
CNN |
FOX |
|||||
| 92,414 | 62.2% | 92 | 92 | ||||
| Ron Paul | 23,559 | 15.8% | |||||
| Newt Gingrich | 19,288 | 13.0% | 1 | 1 | |||
| Rick Santorum | 13,429 | 9.0% | |||||
| Other | |||||||
| Unprojected delegates: | 95 | 95 | 95 | ||||
| Total: | 148,690 | 100.0% | 95 | 95 | 95 | ||
Pennsylvania
Primary date: April 24, 2012
National delegates: 72
Primary:

Pennsylvania results by county
| Pennsylvania Republican primary, April 24, 2012 | |||||||
|---|---|---|---|---|---|---|---|
| Candidate | Votes | Percentage | Projected delegate count | ||||
| AP |
CNN |
FOX |
|||||
| 447,371 | 57.8% | 2 | 2 | ||||
| Rick Santorum | 143,134 | 18.5% | |||||
| Ron Paul | 102,061 | 13.2% | |||||
| Newt Gingrich | 81,693 | 10.6% | |||||
| Other | |||||||
| Unprojected delegates: | 72 | 72 | 72 | ||||
| Total: | 775,172 | 100.0% | 72 | 72 | 72 | ||
Rhode Island
Primary date: April 24, 2012
National delegates: 19
Primary:
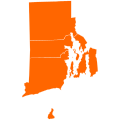
Rhode Island results by county
| Rhode Island Republican primary, April 24, 2012 | |||||||
|---|---|---|---|---|---|---|---|
| Candidate | Votes | Percentage | Projected delegate count | ||||
| AP |
CNN |
FOX |
|||||
| 9,157 | 63.2% | 15 | 15 | ||||
| Ron Paul | 3,462 | 23.9% | 4 | 4 | |||
| Newt Gingrich | 878 | 6.1% | |||||
| Rick Santorum | 823 | 5.7% | |||||
| Buddy Roemer | 38 | 0.3% | |||||
| Other | 131 | 0.9% | |||||
| Unprojected delegates: | 19 | 19 | 19 | ||||
| Total: | 14,489 | 100.0% | 19 | 19 | 19 | ||
Indiana
Primary date: May 8, 2012
National delegates: 46
Primary:

Indiana results by county
| Indiana Republican primary, May 8, 2012 | |||||||
|---|---|---|---|---|---|---|---|
| Candidate | Votes | Percentage | Projected delegate count | ||||
| AP |
CNN |
FOX |
|||||
| 413,717 | 64.7% | 28 | 27 | ||||
| Ron Paul | 99,628 | 15.6 | |||||
| Rick Santorum | 85,255 | 13.3% | |||||
| Newt Gingrich | 41,087 | 6.4% | |||||
| Unprojected delegates: | 18 | 19 | 46 | ||||
| Total: | 639,687 | 100.0% | 46 | 46 | 46 | ||
North Carolina
Primary date: May 8, 2012
National delegates: 55
Primary:

North Carolina results by county
| North Carolina Republican primary, May 8, 2012 | |||||||
|---|---|---|---|---|---|---|---|
| Candidate | Votes | Percentage | Projected delegate count | ||||
| AP |
CNN |
FOX |
|||||
| 634,667 | 65.7% | 36 | 36 | ||||
| Ron Paul | 107,077 | 11.1% | 6 | 6 | |||
| Rick Santorum | 100,633 | 10.4% | 6 | 6 | |||
| Newt Gingrich | 73,857 | 7.6% | 4 | 4 | |||
| no preference | 50,305 | 5.2% | |||||
| Unprojected delegates: | 3 | 3 | 55 | ||||
| Total: | 966,539 | 100.0% | 55 | 55 | 55 | ||
West Virginia
Primary date: May 8, 2012
National delegates: 31
Primary:

West Virginia results by county
| West Virginia Republican primary, May 8, 2012 | |||||||
|---|---|---|---|---|---|---|---|
| Candidate | Votes | Percentage | Projected delegate count | ||||
| AP |
CNN |
FOX |
|||||
| 74,112 | 69.6% | 23 | 21 | ||||
| Rick Santorum | 12,852 | 12.07% | 2 | 2 | |||
| Ron Paul | 11,788 | 11.07% | |||||
| Newt Gingrich | 6,660 | 6.25% | |||||
| Buddy Roemer | 1,078 | 1.01% | |||||
| Unprojected delegates: | 6 | 8 | 31 | ||||
| Total: | 106,490 | 100.0% | 31 | 31 | 31 | ||
Nebraska
Primary date: May 15, 2012
National delegates: 35
Primary:
| Nebraska Republican primary, May 15, 2012 | |||||||
|---|---|---|---|---|---|---|---|
| Candidate | Votes | Percentage | Projected delegate count | ||||
| AP |
CNN |
FOX |
|||||
| 129,548 | 70.9% | ||||||
| Rick Santorum | 25,537 | 14% | |||||
| Ron Paul | 18,199 | 10% | |||||
| Newt Gingrich | 9,523 | 5.2% | |||||
| Other | |||||||
| Unprojected delegates: | 35 | 35 | 35 | ||||
| Total: | 182,807 | 100.0% | 35 | 35 | 35 | ||
Oregon
Primary date: May 15, 2012
National delegates: 28
Primary:

Oregon results by county
| Oregon Republican primary, May 15, 2012 | |||||||
|---|---|---|---|---|---|---|---|
| Candidate | Votes | Percentage | Projected delegate count | ||||
| AP |
CNN |
FOX |
|||||
| 196,460 | 72.2% | 16 | |||||
| Ron Paul | 34,812 | 12.8% | 2 | ||||
| Rick Santorum | 25,825 | 9.5% | 1 | ||||
| Newt Gingrich | 14,856 | 5.5% | |||||
| Other | |||||||
| Unprojected delegates: | 9 | 28 | 28 | ||||
| Total: | 271,953 | 100.0% | 28 | 28 | 28 | ||
Arkansas
Primary date: May 22, 2012
National delegates: 32
Primary:

Arkansas results by county
| Arkansas Republican primary, May 22, 2012 | |||||||
|---|---|---|---|---|---|---|---|
| Candidate | Votes | Percentage | Projected delegate count | ||||
| AP |
CNN |
FOX |
|||||
| 102,421 | 68.3% | 33 | 33 | ||||
| Ron Paul | 20,161 | 13.4% | |||||
| Rick Santorum | 19,994 | 13.3% | |||||
| Newt Gingrich | 7,380 | 4.9% | |||||
| Other | |||||||
| Unprojected delegates: | 3 | 3 | 36 | ||||
| Total: | 148,392 | 100.0% | 36 | 36 | 36 | ||
Kentucky
Primary date: May 22, 2012
National delegates: 45
Primary:

Kentucky results by county
| Kentucky Republican primary, May 22, 2012 | |||||||
|---|---|---|---|---|---|---|---|
| Candidate | Votes | Percentage | Projected delegate count | ||||
| AP |
CNN |
FOX |
|||||
| 117,396 | 66.7% | 42 | 42 | ||||
| Ron Paul | 22,044 | 12.5% | |||||
| Rick Santorum | 15,654 | 8.9% | |||||
| Newt Gingrich | 10,445 | 5.9% | |||||
| no preference | 10,340 | 5.9% | |||||
| Unprojected delegates: | 3 | 3 | 45 | ||||
| Total: | 175,879 | 100.0% | 45 | 45 | 45 | ||
Texas
Primary date: May 29, 2012
National delegates: 155
Primary:
| Texas Republican primary, May 29, 2012 | |||||||
|---|---|---|---|---|---|---|---|
| Candidate | Votes | Percentage | Projected delegate count | ||||
| AP |
CNN |
FOX |
|||||
| 982,965 | 69% | 97 | 97 | ||||
| Ron Paul | 170,582 | 12% | 10 | 10 | |||
| Rick Santorum | 113,562 | 8% | 8 | 8 | |||
| Newt Gingrich | 66,943 | 4.7% | 4 | 4 | |||
| Michele Bachmann | 12,218 | 0.9% | 2 | ||||
| Jon Huntsman | 9,444 | 0.7% | |||||
| Buddy Roemer | 4,665 | 0.3% | |||||
| John Davis | 4,650 | 0.3% | |||||
| Uncommitted | 60,478 | 4.2% | |||||
| Unprojected delegates: | 36 | 36 | 155 | ||||
| Total: | 1,425,507 | 100.0% | 155 | 155 | 155 | ||
California
Primary date: June 5, 2012
National delegates: 172
Primary:

California results by county
| California Republican primary, June 5, 2012 | |||||||
|---|---|---|---|---|---|---|---|
| Candidate | Votes | Percentage | Projected delegate count | ||||
| AP |
CNN |
FOX |
|||||
| 1,151,275 | 79.6% | 171 | 171 | 171 | |||
| Ron Paul | 147,900 | 10.2% | |||||
| Rick Santorum | 75,808 | 5.2% | |||||
| Newt Gingrich | 54,949 | 3.8% | |||||
| Buddy Roemer | 9,716 | 0.7% | |||||
| Fred Karger | 6,481 | 0.4% | |||||
| Unprojected delegates: | 1 | 1 | 1 | ||||
| Total: | 1,446,129 | 100.0% | 172 | 172 | 172 | ||
Montana
Primary date: June 5, 2012
National delegates: 26
Primary:
| Montana Republican primary, June 5, 2012 | |||||||
|---|---|---|---|---|---|---|---|
| Candidate | Votes | Percentage | Projected delegate count | ||||
| AP |
CNN |
FOX |
|||||
| 95,158 | 68.4% | ||||||
| Ron Paul | 19,990 | 14.4% | |||||
| Rick Santorum | 12,412 | 8.9% | |||||
| Newt Gingrich | 6,043 | 4.3% | |||||
| no preference | 5,505 | 4% | |||||
| Unprojected delegates: | 26 | 26 | 26 | ||||
| Total: | 139,135 | 100.0% | 26 | 26 | 26 | ||
New Jersey
Primary date: June 5, 2012
National delegates: 50
Primary:
| New Jersey Republican primary, June 5, 2012 | |||||||
|---|---|---|---|---|---|---|---|
| Candidate | Votes | Percentage | Projected delegate count | ||||
| AP |
CNN |
FOX |
|||||
| 184,575 | 81.3% | 50 | 50 | 50 | |||
| Ron Paul | 23,593 | 10.4% | |||||
| Rick Santorum | 11,883 | 5.2% | |||||
| Newt Gingrich | 7,092 | 3.1% | |||||
| Unprojected delegates: | 0 | 0 | 0 | ||||
| Total: | 227,143 | 100.0% | 50 | 50 | 50 | ||
New Mexico
Primary date: June 5, 2012
National delegates: 23
Primary:
| New Mexico Republican primary, June 5, 2012 | |||||||
|---|---|---|---|---|---|---|---|
| Candidate | Votes | Percentage | Projected delegate count | ||||
| AP |
CNN |
FOX |
|||||
| 67,252 | 73.3% | 16 | |||||
| Rick Santorum | 9,652 | 10.5% | |||||
| Ron Paul | 9,477 | 10.3% | |||||
| Newt Gingrich | 5,364 | 5.8% | |||||
| Unprojected delegates: | 7 | 23 | 23 | ||||
| Total: | 91,745 | 100.0% | 23 | 23 | 23 | ||
South Dakota
Primary date: June 5, 2012
National delegates: 28
Primary:
| South Dakota Republican primary, June 5, 2012 | |||||||
|---|---|---|---|---|---|---|---|
| Candidate | Votes | Percentage | Projected delegate count | ||||
| AP |
CNN |
FOX |
|||||
| 34,033 | 66.1% | 27 | |||||
| Ron Paul | 6,704 | 13% | |||||
| Rick Santorum | 5,916 | 11.5% | |||||
| Uncommitted | 2,797 | 5.4% | |||||
| Newt Gingrich | 2,074 | 4% | |||||
| Unprojected delegates: | 1 | 28 | 28 | ||||
| Total: | 51,524 | 100.0% | 28 | 28 | 28 | ||
Utah
Primary date: June 26, 2012
National delegates: 40
Primary:
| Utah Republican primary, June 26, 2012 | |||||||
|---|---|---|---|---|---|---|---|
| Candidate | Votes | Percentage | Projected delegate count | ||||
| AP |
CNN |
FOX |
|||||
| Ron Paul | |||||||
| Newt Gingrich | |||||||
| Rick Santorum | |||||||
| Unprojected delegates: | 40 | 40 | 40 | ||||
| Total: | 0 | 100.0% | 40 | 40 | 40 | ||